ByC_Boogie33·Sweeps grinder and sports bettor··27 min read
Tate Sandell
Every FBS game from Week 6 is below with the numbers that decided it: yards per play, third downs, turnovers, the closing line and how it graded, plus a short read on what actually happened. Yards per rush excludes sacks.
All 138 FBS teams are ranked under the Team table tab, with strength of schedule played and left, a projected final record and a luck index. Search for your team, or tap any column there to sort.
Free picks and weekly recaps, in your inbox.
Every card we play, emailed before game time, plus a recap of every CFB and NFL game each week. Every result tracked, wins and losses. Free, unsubscribe anytime.
Troy laid 9.5 on Tuesday and won 55-34. Goose Crowder went 18 of 21 for 225, ran for 145 on 17 carries and accounted for four touchdowns. Troy had 662 yards at 8.3 a play and led 31-7 at the half. Southern Miss threw it fine (Landry Lyddy 316 yards, Kaden Saunders 7 for 138) but gave it away three times and went 2 of 8 on third down. The total was 51.5 and they scored 89.
PPR: 1 per catch, 0.1 per rushing or receiving yard, 6 per touchdown, 0.04 per passing yard, 4 per passing touchdown, -2 per interception. Half is half-PPR. Tgt% is the share of the team's targets.
PPR: 1 per catch, 0.1 per rushing or receiving yard, 6 per touchdown, 0.04 per passing yard, 4 per passing touchdown, -2 per interception. Half is half-PPR. Tgt% is the share of the team's targets.
Jacksonville State laid 3 and won 27-26, so Kennesaw cashed. Daniel Kinney's 28-yard field goal put the Owls up 26-24 at 2:15 and Garrison Rippa answered from 33 with 52 seconds left. Kennesaw was the better team per play, 6.3 to 5.2, and Brayden Munroe caught 7 for 159, but Rickie Collins threw two picks. Caden Creel went 26 of 44 for 311. The two teams combined for 230 penalty yards.
PPR: 1 per catch, 0.1 per rushing or receiving yard, 6 per touchdown, 0.04 per passing yard, 4 per passing touchdown, -2 per interception. Half is half-PPR. Tgt% is the share of the team's targets.
PPR: 1 per catch, 0.1 per rushing or receiving yard, 6 per touchdown, 0.04 per passing yard, 4 per passing touchdown, -2 per interception. Half is half-PPR. Tgt% is the share of the team's targets.
FIU laid 7 and covered 22-3 without an offense. Robert Czeremcha kicked five field goals (52, 48 and 40 among them) and the only touchdown was a 1-yard Anthony Carrie run late in the first quarter. FIU averaged 3.3 a play. New Mexico State averaged 4.0 and lost anyway because it gave the ball away three times and Adam Damante went 9 of 22 for 104. 450 combined yards, 25 points.
PPR: 1 per catch, 0.1 per rushing or receiving yard, 6 per touchdown, 0.04 per passing yard, 4 per passing touchdown, -2 per interception. Half is half-PPR. Tgt% is the share of the team's targets.
PPR: 1 per catch, 0.1 per rushing or receiving yard, 6 per touchdown, 0.04 per passing yard, 4 per passing touchdown, -2 per interception. Half is half-PPR. Tgt% is the share of the team's targets.
Liberty laid 13.5 and won 35-3. The Flames averaged 7.8 a play and went 4 of 7 on third down, which is how you only need 53 snaps. Jaylon Coleman ran seven times for 92, Deshawn Purdie went 10 of 14 for 114, Ethan Vasko ran in two short scores. Sam Houston had 243 yards, no turnovers, and nothing else. Liberty's 117 penalty yards were the only thing slowing it down.
PPR: 1 per catch, 0.1 per rushing or receiving yard, 6 per touchdown, 0.04 per passing yard, 4 per passing touchdown, -2 per interception. Half is half-PPR. Tgt% is the share of the team's targets.
PPR: 1 per catch, 0.1 per rushing or receiving yard, 6 per touchdown, 0.04 per passing yard, 4 per passing touchdown, -2 per interception. Half is half-PPR. Tgt% is the share of the team's targets.
Western KentuckyGlenn 20/35, 231 yds, 1 TD; Allen 13 car, 105 yds, 2 TD
Missouri State laid 1.5 on the road and lost 34-13. Western Kentucky went 9 of 17 on third down, Missouri State went 4 of 15, and that gap was the game. Ajay Allen ran 13 times for 105 and two scores, the second a 39-yarder with 5:46 left. Brock Glenn threw for 231. Missouri State was within 21-13 midway through the third after Isaiah Myers' 36-yard catch and did not score again.
PPR: 1 per catch, 0.1 per rushing or receiving yard, 6 per touchdown, 0.04 per passing yard, 4 per passing touchdown, -2 per interception. Half is half-PPR. Tgt% is the share of the team's targets.
PPR: 1 per catch, 0.1 per rushing or receiving yard, 6 per touchdown, 0.04 per passing yard, 4 per passing touchdown, -2 per interception. Half is half-PPR. Tgt% is the share of the team's targets.
UTSA laid 5.5 and won 31-24, and the cover came on a two-point conversion. South Florida led 24-23 after D.J. Crowther's 11-yard catch with 1:56 left. A'Marion Peterson scored from the 1 with 15 seconds to go, his third touchdown, and Owen McCown hit David Amador for two to make the margin seven. Peterson ran 12 times for 92 (a 53-yarder on the first drive). UTSA had 486 yards and went 8 of 14 on third down; the Bulls were 3 of 11. Zero turnovers in the game.
PPR: 1 per catch, 0.1 per rushing or receiving yard, 6 per touchdown, 0.04 per passing yard, 4 per passing touchdown, -2 per interception. Half is half-PPR. Tgt% is the share of the team's targets.
PPR: 1 per catch, 0.1 per rushing or receiving yard, 6 per touchdown, 0.04 per passing yard, 4 per passing touchdown, -2 per interception. Half is half-PPR. Tgt% is the share of the team's targets.
South Alabama caught 3 and won 56-49. Keenan Phillips ran 19 times for 157 and three touchdowns, and returned a kickoff 100 yards for a fourth. The Jaguars scored two touchdowns 22 seconds apart late in the first half (two 3-yard Jared Hollins runs) to go up 34-21. Arkansas State had 516 yards, went 8 of 10 on third down and Trey Owens threw for 418 and four touchdowns. He also threw two picks and the Red Wolves gave it away three times. The total was 60.5 and they scored 105.
PPR: 1 per catch, 0.1 per rushing or receiving yard, 6 per touchdown, 0.04 per passing yard, 4 per passing touchdown, -2 per interception. Half is half-PPR. Tgt% is the share of the team's targets.
PPR: 1 per catch, 0.1 per rushing or receiving yard, 6 per touchdown, 0.04 per passing yard, 4 per passing touchdown, -2 per interception. Half is half-PPR. Tgt% is the share of the team's targets.
BYU laid 11.5 and covered 24-10, with the cover coming on Matthias Dunn's 38-yard field goal with 1:51 left. Iowa State had 200 yards, went 2 of 13 on third down and Jaylen Raynor threw for 98. Bear Bachmeier went 22 of 30 for 329 and ran nine times for 109. Legend Glasker's 75-yard catch late in the third made it 21-3. The Cyclones got within 21-10 early in the fourth and that was the number until Dunn's kick.
PPR: 1 per catch, 0.1 per rushing or receiving yard, 6 per touchdown, 0.04 per passing yard, 4 per passing touchdown, -2 per interception. Half is half-PPR. Tgt% is the share of the team's targets.
PPR: 1 per catch, 0.1 per rushing or receiving yard, 6 per touchdown, 0.04 per passing yard, 4 per passing touchdown, -2 per interception. Half is half-PPR. Tgt% is the share of the team's targets.
Iowa caught 3 on the road and won 41-24. Kamari Moulton ran 26 times for 208 with a 56-yard score, Jeremy Hecklinski went 14 of 19 for 202 and three touchdowns, and the Hawkeyes led 27-0 with five minutes left in the half. Washington took six sacks and ran it at 2.5 a carry. Elijah Brown threw for 251 and three touchdowns, all of it from behind. Iowa averaged 8.2 a play. No turnovers in the game.
PPR: 1 per catch, 0.1 per rushing or receiving yard, 6 per touchdown, 0.04 per passing yard, 4 per passing touchdown, -2 per interception. Half is half-PPR. Tgt% is the share of the team's targets.
PPR: 1 per catch, 0.1 per rushing or receiving yard, 6 per touchdown, 0.04 per passing yard, 4 per passing touchdown, -2 per interception. Half is half-PPR. Tgt% is the share of the team's targets.
Louisville laid 4 and won 44-20 after trailing 14-0. Isaac Brown's 97-yard touchdown run in the second quarter flipped it and he finished with 235 on 17 carries, a 68-yarder in the fourth as well. Louisville ran it at 9.6 a carry and averaged 9.3 a play. Lincoln Kienholz went 11 of 15 and ran in two short scores. Ashton Daniels threw for 209 and two touchdowns to Micahi Danzy but took four sacks.
PPR: 1 per catch, 0.1 per rushing or receiving yard, 6 per touchdown, 0.04 per passing yard, 4 per passing touchdown, -2 per interception. Half is half-PPR. Tgt% is the share of the team's targets.
PPR: 1 per catch, 0.1 per rushing or receiving yard, 6 per touchdown, 0.04 per passing yard, 4 per passing touchdown, -2 per interception. Half is half-PPR. Tgt% is the share of the team's targets.
Utah State laid 4 and won 17-16, so Washington State cashed. The Cougars led 16-3 after Leo Pulalasi's 54-yard run with 3:32 left in the half and never scored again. Eli Wood's 27-yard catch and Javen Jacobs' 2-yard run with 6:22 left got the Aggies there. Both offenses were under 4.3 a play. Washington State went 5 of 19 on third down, gave it away twice and took 113 penalty yards. Jack Stevens kicked three field goals, one from 50.
PPR: 1 per catch, 0.1 per rushing or receiving yard, 6 per touchdown, 0.04 per passing yard, 4 per passing touchdown, -2 per interception. Half is half-PPR. Tgt% is the share of the team's targets.
PPR: 1 per catch, 0.1 per rushing or receiving yard, 6 per touchdown, 0.04 per passing yard, 4 per passing touchdown, -2 per interception. Half is half-PPR. Tgt% is the share of the team's targets.
San José StateWeaver 26/38, 251 yds, 1 INT; Clark 8 rec, 91 yds
Wyoming caught 4.5 and won 16-13 in overtime on an Erik Sandvik 21-yard field goal. Tyler Hughes ran 27 times for 92 and threw an 8-yard touchdown to Jake Wilson with 6:25 left to tie it at 13. Ten sacks in the game, six on Wyoming. The Cowboys went 3 of 15 on third down and still won. San José State was slightly better per play, 4.9 to 4.5, and Luke Weaver threw for 251 with a pick. The total was 42.5 and they scored 29.
PPR: 1 per catch, 0.1 per rushing or receiving yard, 6 per touchdown, 0.04 per passing yard, 4 per passing touchdown, -2 per interception. Half is half-PPR. Tgt% is the share of the team's targets.
PPR: 1 per catch, 0.1 per rushing or receiving yard, 6 per touchdown, 0.04 per passing yard, 4 per passing touchdown, -2 per interception. Half is half-PPR. Tgt% is the share of the team's targets.
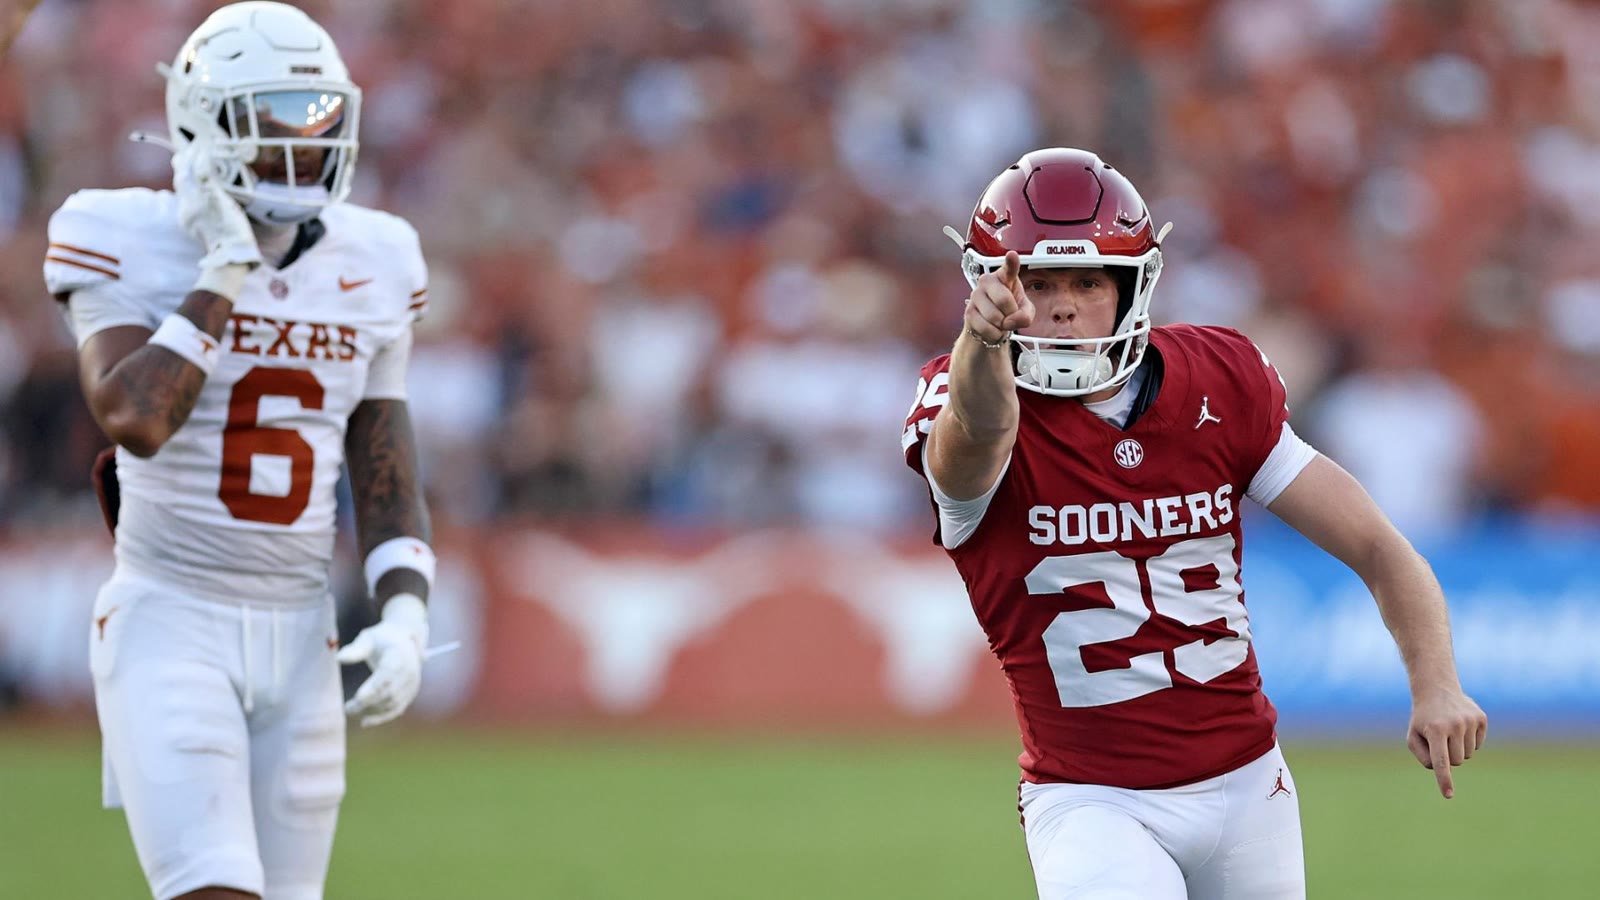
Texas laid 7.5 and lost 27-24. Oklahoma scored 14 of its 27 on defense and special teams: Dakoda Fields returned a blocked punt for a score to tie it 7-7, and Peyton Bowen's 42-yard interception return with 10:07 left made it 24-17. Arch Manning threw for 260 and three touchdowns (41 yards to Cam Coleman, 34 to Ryan Wingo, 15 to Jermaine Bishop to tie it at 6:32) and two picks. Tate Sandell hit from 47 as time expired. Oklahoma's offense had 238 yards, 4.2 a play, and went 2 of 13 on third down. John Mateer threw for 155 with no touchdowns. Texas was the better team by every yardage number and lost on two plays.
PPR: 1 per catch, 0.1 per rushing or receiving yard, 6 per touchdown, 0.04 per passing yard, 4 per passing touchdown, -2 per interception. Half is half-PPR. Tgt% is the share of the team's targets.
PPR: 1 per catch, 0.1 per rushing or receiving yard, 6 per touchdown, 0.04 per passing yard, 4 per passing touchdown, -2 per interception. Half is half-PPR. Tgt% is the share of the team's targets.
Georgia caught 2.5 and won 20-17. Gunner Stockton went 18 of 22 for 249 and ran 14 yards for the go-ahead score early in the third; Dwight Phillips ran 17 times for 120. Alabama led 14-10 at the half on EJ Crowell's 1-yard run as time expired. Conor Talty tied it 17-17 from 39 and Peyton Woodring's 23-yarder with 5:25 left was the last score. Georgia averaged 10.8 net yards a pass attempt. Keelon Russell went 16 of 30 for 185 and took three sacks. The total was 51.5 and they scored 37.
PPR: 1 per catch, 0.1 per rushing or receiving yard, 6 per touchdown, 0.04 per passing yard, 4 per passing touchdown, -2 per interception. Half is half-PPR. Tgt% is the share of the team's targets.
PPR: 1 per catch, 0.1 per rushing or receiving yard, 6 per touchdown, 0.04 per passing yard, 4 per passing touchdown, -2 per interception. Half is half-PPR. Tgt% is the share of the team's targets.
Notre Dame laid 40.5 and covered 58-7. Jonaz Walton ran 13 times for 181 with touchdowns of 97 and 40 yards, CJ Carr went 14 of 20 for 181 and three scores (a 70-yarder to Aneyas Williams), and it was 37-0 with 3:26 left in the half. Notre Dame had 598 yards. Stanford gave it away three times, ran it at 2.8 a carry, and scored on Davis Warren's 3-yard throw to Benji Blackburn in the third.
PPR: 1 per catch, 0.1 per rushing or receiving yard, 6 per touchdown, 0.04 per passing yard, 4 per passing touchdown, -2 per interception. Half is half-PPR. Tgt% is the share of the team's targets.
PPR: 1 per catch, 0.1 per rushing or receiving yard, 6 per touchdown, 0.04 per passing yard, 4 per passing touchdown, -2 per interception. Half is half-PPR. Tgt% is the share of the team's targets.
Ohio State laid 31.5 and won 45-16, so Maryland cashed by 2.5. Maryland had 146 total yards, 64 of them passing, and averaged 2.8 a play. The 16 came from a short run, a field goal and Daniel Wingate's 52-yard interception return. Julian Sayin threw four touchdowns on 13 completions, Jeremiah Smith caught two of them for 93, and Bo Jackson ran 23 times for 107 with two scores. Two Ohio State giveaways kept the number alive.
PPR: 1 per catch, 0.1 per rushing or receiving yard, 6 per touchdown, 0.04 per passing yard, 4 per passing touchdown, -2 per interception. Half is half-PPR. Tgt% is the share of the team's targets.
PPR: 1 per catch, 0.1 per rushing or receiving yard, 6 per touchdown, 0.04 per passing yard, 4 per passing touchdown, -2 per interception. Half is half-PPR. Tgt% is the share of the team's targets.
Indiana laid 9.5 and won 20-17, so Nebraska cashed. Nebraska led 17-6 after Anthony Colandrea's 39-yard run with 12:01 left. Nick Marsh then caught a 75-yard touchdown ten seconds later and a 44-yarder at 7:13 to win it; he finished 6 for 187. Indiana ran 44 plays and went 1 of 10 on third down. Nebraska ran 83, went 10 of 19 on third down, took five sacks and Colandrea threw a pick. Josh Hoover went 12 of 22 for 263. Under 48.5 by a lot.
PPR: 1 per catch, 0.1 per rushing or receiving yard, 6 per touchdown, 0.04 per passing yard, 4 per passing touchdown, -2 per interception. Half is half-PPR. Tgt% is the share of the team's targets.
PPR: 1 per catch, 0.1 per rushing or receiving yard, 6 per touchdown, 0.04 per passing yard, 4 per passing touchdown, -2 per interception. Half is half-PPR. Tgt% is the share of the team's targets.
Ole Miss laid 9.5 and won 52-17. It was 42-3 at the half after Suntarine Perkins returned a fumble five yards for a score and Michael Smith caught a 4-yard touchdown 20 seconds later. Trinidad Chambliss threw three touchdowns on 213 yards and ran for another. Vanderbilt gave it away four times and Jared Curtis threw two picks. 92 Vanderbilt penalty yards on top of it.
PPR: 1 per catch, 0.1 per rushing or receiving yard, 6 per touchdown, 0.04 per passing yard, 4 per passing touchdown, -2 per interception. Half is half-PPR. Tgt% is the share of the team's targets.
PPR: 1 per catch, 0.1 per rushing or receiving yard, 6 per touchdown, 0.04 per passing yard, 4 per passing touchdown, -2 per interception. Half is half-PPR. Tgt% is the share of the team's targets.
LSU laid 9.5 and lost 35-34 in overtime. Brock Coffman returned a punt 55 yards for a Kentucky touchdown in the second quarter. LSU led 27-24 on a 41-yard trick-play throw from receiver Jackson Harris to Roman Mothershed with 9:42 left, and Adam Zouagui tied it from 33 with 12 seconds on the clock. In overtime Sam Leavitt ran 15 yards for a touchdown, CJ Baxter answered from the 1 and Kenny Minchey ran in the two-point conversion. Baxter ran 19 times for 123 and two scores. Leavitt threw for 275 and two touchdowns with a pick, and LSU's two giveaways to Kentucky's zero decided a game the yards called even (410 to 401). Kentucky had 20 penalty yards.
PPR: 1 per catch, 0.1 per rushing or receiving yard, 6 per touchdown, 0.04 per passing yard, 4 per passing touchdown, -2 per interception. Half is half-PPR. Tgt% is the share of the team's targets.
PPR: 1 per catch, 0.1 per rushing or receiving yard, 6 per touchdown, 0.04 per passing yard, 4 per passing touchdown, -2 per interception. Half is half-PPR. Tgt% is the share of the team's targets.
Utah laid 15.5 and covered 41-24 by 1.5 points. Kansas was within 27-24 after Nik McMillan's 29-yard catch late in the third. Semi Taulanga's 1-yard catch at 10:45 and Wayshawn Parker's 90-yard run at 7:13 ended it. Parker ran 16 times for 171 and two scores; Devon Dampier went 23 of 30 for 238 and three touchdowns. Isaiah Marshall threw for 333 and Cam Pickett caught 8 for 134, but Kansas ran it at 2.8 a carry.
PPR: 1 per catch, 0.1 per rushing or receiving yard, 6 per touchdown, 0.04 per passing yard, 4 per passing touchdown, -2 per interception. Half is half-PPR. Tgt% is the share of the team's targets.
PPR: 1 per catch, 0.1 per rushing or receiving yard, 6 per touchdown, 0.04 per passing yard, 4 per passing touchdown, -2 per interception. Half is half-PPR. Tgt% is the share of the team's targets.
UCLA caught 10 and won 17-15. Oregon gave the ball away seven times. Seven. The Ducks had 272 yards, went 1 of 12 on third down and ran it at 2.7 a carry. UCLA gave it away three times itself (Nico Iamaleava threw two picks on 17 attempts) and still led 17-6 early in the fourth after Wayne Knight's 9-yard catch from Ty Dieffenbach. Knight ran 22 times for 103 with a 35-yard score. Evan Stewart's 44-yard catch with 2:16 left made it 17-15 and the two-point run failed. The total was 57.5 and they scored 32.
PPR: 1 per catch, 0.1 per rushing or receiving yard, 6 per touchdown, 0.04 per passing yard, 4 per passing touchdown, -2 per interception. Half is half-PPR. Tgt% is the share of the team's targets.
PPR: 1 per catch, 0.1 per rushing or receiving yard, 6 per touchdown, 0.04 per passing yard, 4 per passing touchdown, -2 per interception. Half is half-PPR. Tgt% is the share of the team's targets.
Missouri laid 4.5 and won 27-6. Jamal Roberts ran 34 times for 222 and two touchdowns, a 54-yarder with 2:49 left. Blake Craig kicked field goals from 50 and 51. Texas A&M had 216 yards, ran it at 1.8 a carry, and Marcel Reed went 19 of 39 for 187 with two picks and three sacks. Missouri led 20-3 through three quarters. The total was 50.5 and they scored 33.
PPR: 1 per catch, 0.1 per rushing or receiving yard, 6 per touchdown, 0.04 per passing yard, 4 per passing touchdown, -2 per interception. Half is half-PPR. Tgt% is the share of the team's targets.
PPR: 1 per catch, 0.1 per rushing or receiving yard, 6 per touchdown, 0.04 per passing yard, 4 per passing touchdown, -2 per interception. Half is half-PPR. Tgt% is the share of the team's targets.
Tennessee laid 13.5 and won 24-17, so Arkansas cashed. Arkansas led 14-7 midway through the third on Jaden Platt's 4-yard catch. DaSaahn Brame's 1-yard run put the Vols up 17-14, Max Gilbert tied it from 55 with 7:20 left, and DeSean Bishop's 8-yard run at 1:57 won it. Bishop ran 19 times for 138. Tennessee had 414 yards to 288 and averaged 6.5 a play, but gave it away three times; George MacIntyre threw for 247 with two picks. Arkansas went 2 of 11 on third down. The total was 51.5 and they scored 41.
PPR: 1 per catch, 0.1 per rushing or receiving yard, 6 per touchdown, 0.04 per passing yard, 4 per passing touchdown, -2 per interception. Half is half-PPR. Tgt% is the share of the team's targets.
PPR: 1 per catch, 0.1 per rushing or receiving yard, 6 per touchdown, 0.04 per passing yard, 4 per passing touchdown, -2 per interception. Half is half-PPR. Tgt% is the share of the team's targets.
South Carolina caught 10.5 and won 38-19. LaNorris Sellers went 23 of 35 for 279 and four touchdowns to four different receivers, and ran in a fifth. The Gamecocks went 10 of 16 on third down. Florida scored on the first drive, Bailey Stockton for 59 yards, and led 10-7 before South Carolina took it over: 28 of the next 31 points. Three Florida giveaways. Aaron Philo went 21 of 28 for 227 with a pick. The yards were nearly even, 393 to 387.
PPR: 1 per catch, 0.1 per rushing or receiving yard, 6 per touchdown, 0.04 per passing yard, 4 per passing touchdown, -2 per interception. Half is half-PPR. Tgt% is the share of the team's targets.
PPR: 1 per catch, 0.1 per rushing or receiving yard, 6 per touchdown, 0.04 per passing yard, 4 per passing touchdown, -2 per interception. Half is half-PPR. Tgt% is the share of the team's targets.
Oklahoma State laid 10.5 and covered 42-28 by 3.5. It was 21-21 at the half. Sam Keltner kicked two field goals for a 27-21 lead, then Evan Jackson returned a fumble 28 yards for a score and Drew Mestemaker ran in the two-pointer with 10:32 left. Mestemaker threw for 304 and two touchdowns, 10.5 net yards an attempt. UCF ran 83 plays and went 7 of 16 on third down, Keyone Jenkins threw four touchdowns on 265 yards with a pick, and the Knights ran it at 2.8 a carry. Caden Piening's 4-yard catch at 3:57 cut it to 14.
PPR: 1 per catch, 0.1 per rushing or receiving yard, 6 per touchdown, 0.04 per passing yard, 4 per passing touchdown, -2 per interception. Half is half-PPR. Tgt% is the share of the team's targets.
PPR: 1 per catch, 0.1 per rushing or receiving yard, 6 per touchdown, 0.04 per passing yard, 4 per passing touchdown, -2 per interception. Half is half-PPR. Tgt% is the share of the team's targets.
USC laid 1.5 and won 31-23. It was 17-17 at the half and Penn State led 20-17 and 23-24 on Ryan Barker field goals. Kayden Dixon-Wyatt's 10-yard catch with 11:11 left was the last score. Jayden Maiava went 21 of 33 for 301 and three touchdowns, Trent Mosley caught 9 for 111, and King Miller ran 19 times for 102. Penn State went 2 of 12 on third down and ran it at 3.0 a carry (Carson Hansen 14 for 28). Rocco Becht threw for 289. The total was 54.5 and they scored 54.
PPR: 1 per catch, 0.1 per rushing or receiving yard, 6 per touchdown, 0.04 per passing yard, 4 per passing touchdown, -2 per interception. Half is half-PPR. Tgt% is the share of the team's targets.
PPR: 1 per catch, 0.1 per rushing or receiving yard, 6 per touchdown, 0.04 per passing yard, 4 per passing touchdown, -2 per interception. Half is half-PPR. Tgt% is the share of the team's targets.
Houston caught 2.5 and won 35-16. Patrick Overmyer caught four touchdowns, from 1, 2, 8 and 2 yards, all from Conner Weigman, who went 19 of 30 for 242. Houston led 35-9 with under a minute left in the third. 475 yards for the Cougars at 6.5 a play. Avery Johnson threw for 182 and two scores with a pick. The total was 55.5 and they scored 51.
PPR: 1 per catch, 0.1 per rushing or receiving yard, 6 per touchdown, 0.04 per passing yard, 4 per passing touchdown, -2 per interception. Half is half-PPR. Tgt% is the share of the team's targets.
PPR: 1 per catch, 0.1 per rushing or receiving yard, 6 per touchdown, 0.04 per passing yard, 4 per passing touchdown, -2 per interception. Half is half-PPR. Tgt% is the share of the team's targets.
Boise State laid 8.5 and won 38-31, so Fresno State cashed on Manaki Watanabe's 47-yard field goal with 36 seconds left. Dylan Riley ran 72 yards for a score on the first drive and caught a 44-yarder on the first play of the fourth for a 35-20 lead; he had 150 rushing and 64 receiving. Fresno State went 3 of 6 on third down and averaged 6.8 a play to Boise's 6.5. Ezekiel Avit caught 6 for 96 and two touchdowns. No turnovers in the game. Boise State had 512 yards and 83 penalty yards.
PPR: 1 per catch, 0.1 per rushing or receiving yard, 6 per touchdown, 0.04 per passing yard, 4 per passing touchdown, -2 per interception. Half is half-PPR. Tgt% is the share of the team's targets.
PPR: 1 per catch, 0.1 per rushing or receiving yard, 6 per touchdown, 0.04 per passing yard, 4 per passing touchdown, -2 per interception. Half is half-PPR. Tgt% is the share of the team's targets.
North Carolina caught 3.5 and won 21-17. Pitt took a 17-14 lead on La'Vell Wright's 1-yard run with 12:47 left. Eleven seconds later Billy Edwards hit Shamar Easter for 75 yards. Edwards went 18 of 26 for 249 with two touchdowns and two picks. The Tar Heels ran it at 1.1 a carry. Pitt ran 85 plays for 369 yards and Holden Geriner threw 44 times for 219 with no touchdowns and two picks. Two giveaways each.
PPR: 1 per catch, 0.1 per rushing or receiving yard, 6 per touchdown, 0.04 per passing yard, 4 per passing touchdown, -2 per interception. Half is half-PPR. Tgt% is the share of the team's targets.
PPR: 1 per catch, 0.1 per rushing or receiving yard, 6 per touchdown, 0.04 per passing yard, 4 per passing touchdown, -2 per interception. Half is half-PPR. Tgt% is the share of the team's targets.
West VirginiaHawkins Jr. 11/28, 219 yds; Cook 34 car, 141 yds, 2 TD
Arizona laid 3.5 and won 52-31. Noah Fifita went 16 of 23 for 341 and three touchdowns, Isaiah Mizell caught 6 for 183 with scores of 14 and 72 yards, and Lee Molette returned a fumble 32 yards in the first quarter. West Virginia ran 104 plays for 522 yards, Cam Cook carried 34 times for 141 and two scores, and the Mountaineers were within 38-31 with 12:33 left. Brandon Phelps' 42-yard catch and Antwan Roberts' 30-yard run came in the next three minutes. Arizona averaged 9.5 a play and 13.6 net yards a pass attempt. The total was 61.5 and they scored 83.
PPR: 1 per catch, 0.1 per rushing or receiving yard, 6 per touchdown, 0.04 per passing yard, 4 per passing touchdown, -2 per interception. Half is half-PPR. Tgt% is the share of the team's targets.
PPR: 1 per catch, 0.1 per rushing or receiving yard, 6 per touchdown, 0.04 per passing yard, 4 per passing touchdown, -2 per interception. Half is half-PPR. Tgt% is the share of the team's targets.
Wake Forest laid 4 and won 38-14 after trailing 14-10 at the half. Four straight Wake touchdowns in the second half: Carlos Hernandez and Jack Foley on Gio Lopez throws, a Lopez sneak and a 17-yard Deuce Lawrence run. Lopez went 26 of 33 for 303 and three scores; Foley caught 8 for 156. NC State ran it at 2.3 a carry (Davion Gause 7 for 11) and CJ Bailey took three sacks while throwing for 241.
PPR: 1 per catch, 0.1 per rushing or receiving yard, 6 per touchdown, 0.04 per passing yard, 4 per passing touchdown, -2 per interception. Half is half-PPR. Tgt% is the share of the team's targets.
PPR: 1 per catch, 0.1 per rushing or receiving yard, 6 per touchdown, 0.04 per passing yard, 4 per passing touchdown, -2 per interception. Half is half-PPR. Tgt% is the share of the team's targets.
Army laid 5.5 and won 20-17, so Tulane cashed. Cale Hellums ran 38 times for 223 and two touchdowns and threw it six times. Tulane led 17-10 on Jaylin Lucas' 39-yard catch with 7:44 left; Hellums ran 58 yards to tie it 50 seconds later and Dawson Jones kicked a 25-yarder as time expired. Army went 8 of 15 on third down. Tulane had 280 yards and Kadin Semonza threw a pick. The total was 48.5 and they scored 37.
PPR: 1 per catch, 0.1 per rushing or receiving yard, 6 per touchdown, 0.04 per passing yard, 4 per passing touchdown, -2 per interception. Half is half-PPR. Tgt% is the share of the team's targets.
PPR: 1 per catch, 0.1 per rushing or receiving yard, 6 per touchdown, 0.04 per passing yard, 4 per passing touchdown, -2 per interception. Half is half-PPR. Tgt% is the share of the team's targets.
Bowling Green laid 9.5 and won 38-10. Sacramento State led 3-0 and then gave up 38 straight, the last on D'kyah Banks' 27-yard fumble return early in the fourth. Austyn Dendy ran 15 times for 86 and two scores (a 30-yarder in the third). Jay Kastantin went 11 of 15 and ran in a touchdown. Sacramento State had 215 yards, ran it at 2.5 a carry, went 3 of 14 on third down and took 85 penalty yards.
PPR: 1 per catch, 0.1 per rushing or receiving yard, 6 per touchdown, 0.04 per passing yard, 4 per passing touchdown, -2 per interception. Half is half-PPR. Tgt% is the share of the team's targets.
PPR: 1 per catch, 0.1 per rushing or receiving yard, 6 per touchdown, 0.04 per passing yard, 4 per passing touchdown, -2 per interception. Half is half-PPR. Tgt% is the share of the team's targets.
Northwestern laid 34.5 and won 45-14, so Ball State cashed by 3.5. Aidan Chiles went 17 of 23 for 272 and three touchdowns and ran in another; Griffin Wilde caught 8 for 144. Robert Fitzgerald returned a pick 15 yards for a score in the second quarter. It was 45-14 with 53 seconds left in the third and nobody scored in the fourth. Ball State threw it 41 times for 209 and took 119 penalty yards.
PPR: 1 per catch, 0.1 per rushing or receiving yard, 6 per touchdown, 0.04 per passing yard, 4 per passing touchdown, -2 per interception. Half is half-PPR. Tgt% is the share of the team's targets.
PPR: 1 per catch, 0.1 per rushing or receiving yard, 6 per touchdown, 0.04 per passing yard, 4 per passing touchdown, -2 per interception. Half is half-PPR. Tgt% is the share of the team's targets.
East Carolina laid 10 and won 28-12. Rice led 9-7 on Tyvonn Byars' 23-yard run early in the third (Byars ran 14 times for 111). Ray Ray Joseph's second touchdown catch put ECU ahead, TJ Engleman went 43 yards on the first play of the fourth and Emory Williams ran in a 12-yarder 80 seconds later. Rice threw it four times all game (Gael Ochoa 2 of 4 for 48), gave it away twice and went 3 of 15 on third down. Engleman ran 14 times for 136.
PPR: 1 per catch, 0.1 per rushing or receiving yard, 6 per touchdown, 0.04 per passing yard, 4 per passing touchdown, -2 per interception. Half is half-PPR. Tgt% is the share of the team's targets.
PPR: 1 per catch, 0.1 per rushing or receiving yard, 6 per touchdown, 0.04 per passing yard, 4 per passing touchdown, -2 per interception. Half is half-PPR. Tgt% is the share of the team's targets.
Old Dominion caught 8.5 and won 10-3. No points until James London's 34-yard field goal in the third quarter. A safety made it 3-2, then Maurki James scored from the 2 with 9:30 left and Quinn Henicle threw the two-pointer to Josh Rodriguez. App State had 158 yards, averaged 2.9 a play, went 1 of 13 on third down, and Malachi Singleton went 5 of 23 for 72. Three giveaways each. Devin Roche ran 23 times for 101. The total was 45.5 and they scored 13.
PPR: 1 per catch, 0.1 per rushing or receiving yard, 6 per touchdown, 0.04 per passing yard, 4 per passing touchdown, -2 per interception. Half is half-PPR. Tgt% is the share of the team's targets.
PPR: 1 per catch, 0.1 per rushing or receiving yard, 6 per touchdown, 0.04 per passing yard, 4 per passing touchdown, -2 per interception. Half is half-PPR. Tgt% is the share of the team's targets.
Miami laid 6 and won 20-19, so UMass cashed. Miami led 20-10 with 11:36 left. Derek Morris kicked a 34-yarder, then Logan Inagawa hit Max Dowling for 21 yards with one second left and the two-point run failed. Caleb Heavner went 6 of 20 for 95 and ran 11 times for 54 with a score. UMass was better per play, 4.9 to 4.6, and T.Y. Harding caught 9 for 91. Morris also hit a 56-yarder in the second quarter.
PPR: 1 per catch, 0.1 per rushing or receiving yard, 6 per touchdown, 0.04 per passing yard, 4 per passing touchdown, -2 per interception. Half is half-PPR. Tgt% is the share of the team's targets.
PPR: 1 per catch, 0.1 per rushing or receiving yard, 6 per touchdown, 0.04 per passing yard, 4 per passing touchdown, -2 per interception. Half is half-PPR. Tgt% is the share of the team's targets.
Georgia Tech was a 4.5-point home dog and won 28-25. Trelain Maddox ran 10 times for 81 and three touchdowns, a 60-yarder in the third and the 1-yard winner with 54 seconds left. Duke had taken a 25-21 lead on Nate Sheppard's second score at 2:40. Sheppard ran 27 times for 99 and caught 7 for 91. Duke went 10 of 17 on third down and ran 77 plays. Zero turnovers and zero sacks in the game. Alberto Mendoza went 23 of 30 for 218 and Jordan Allen caught 10 for 99. Georgia Tech took 110 penalty yards and still won.
PPR: 1 per catch, 0.1 per rushing or receiving yard, 6 per touchdown, 0.04 per passing yard, 4 per passing touchdown, -2 per interception. Half is half-PPR. Tgt% is the share of the team's targets.
PPR: 1 per catch, 0.1 per rushing or receiving yard, 6 per touchdown, 0.04 per passing yard, 4 per passing touchdown, -2 per interception. Half is half-PPR. Tgt% is the share of the team's targets.
Virginia Tech laid 11.5 and lost 25-20. Three failed two-point conversions in the fourth quarter, every one of them mattering. Carson Perry-Smith's 3-yard catch put Cal up 19-14 at 4:06, Ethan Grunkemeyer's sneak put Tech up 20-19 at 1:15, and Ashten Emory's 2-yard run with 18 seconds left won it. Jackson Brousseau threw 43 times for 321. Cal went 8 of 16 on third down. Virginia Tech was better per play, 6.4 to 5.8, and the yards were 401 to 403; Grunkemeyer threw for 288 and took three sacks. No turnovers, 187 combined penalty yards.
PPR: 1 per catch, 0.1 per rushing or receiving yard, 6 per touchdown, 0.04 per passing yard, 4 per passing touchdown, -2 per interception. Half is half-PPR. Tgt% is the share of the team's targets.
PPR: 1 per catch, 0.1 per rushing or receiving yard, 6 per touchdown, 0.04 per passing yard, 4 per passing touchdown, -2 per interception. Half is half-PPR. Tgt% is the share of the team's targets.
Illinois laid 2.5 and won 38-37 in overtime, so Michigan State cashed. Illinois led 23-7 midway through the third. From there Michigan State outscored Illinois 24-8 the rest of regulation: a Liam Boyd field goal, Jaziun Patterson's 11-yard run, Fredrick Moore's 24-yard catch and Patterson from the 2 with 1:17 left, with Illinois' only answer Collin Dixon's 14-yard touchdown from Michael Clayton II and a two-point run. Clayton hit Hudson Clement for 25 in overtime; Patterson scored from the 1 and the two-point pass failed. Patterson had four touchdowns (17 carries for 93 plus a receiving score). Alessio Milivojevic went 22 of 26. The total was 48.5 and they scored 75.
PPR: 1 per catch, 0.1 per rushing or receiving yard, 6 per touchdown, 0.04 per passing yard, 4 per passing touchdown, -2 per interception. Half is half-PPR. Tgt% is the share of the team's targets.
PPR: 1 per catch, 0.1 per rushing or receiving yard, 6 per touchdown, 0.04 per passing yard, 4 per passing touchdown, -2 per interception. Half is half-PPR. Tgt% is the share of the team's targets.
North Texas laid 27.5 and won 50-10. Tayven Jackson went 24 of 31 for 349 and five touchdowns; Justin Stevenson caught two of them for 122. Derrick Eley's 75-yard catch for Charlotte and Baron Tipton's 75-yard catch for North Texas came 13 seconds apart in the second quarter. A safety and Jahiem White's 61-yard run followed and it was 40-10 at the half. Charlotte took five sacks and Conner Harrell threw two picks.
PPR: 1 per catch, 0.1 per rushing or receiving yard, 6 per touchdown, 0.04 per passing yard, 4 per passing touchdown, -2 per interception. Half is half-PPR. Tgt% is the share of the team's targets.
PPR: 1 per catch, 0.1 per rushing or receiving yard, 6 per touchdown, 0.04 per passing yard, 4 per passing touchdown, -2 per interception. Half is half-PPR. Tgt% is the share of the team's targets.
Navy laid 3 and won 34-26 after trailing 20-7 late in the half and 26-14 in the third. Jackson Gutierrez ran 41 times for 232 and three touchdowns, the go-ahead 4-yarder at 8:30 and a 3-yarder at 1:10, and threw a 58-yard score to Truman Brasfield on five completions. Navy gave the ball away four times, went 8 of 11 on third down, and won. Baylor Hayes threw for 268. The total was 47.5 and they scored 60.
PPR: 1 per catch, 0.1 per rushing or receiving yard, 6 per touchdown, 0.04 per passing yard, 4 per passing touchdown, -2 per interception. Half is half-PPR. Tgt% is the share of the team's targets.
PPR: 1 per catch, 0.1 per rushing or receiving yard, 6 per touchdown, 0.04 per passing yard, 4 per passing touchdown, -2 per interception. Half is half-PPR. Tgt% is the share of the team's targets.
Eastern Michigan laid 4.5 and won 25-23, so Akron cashed. Harold Mack's 6-yard catch put EMU up 22-17 early in the fourth, Marquese Williams' 27-yard catch put Akron up 23-22 at 6:27 (both two-point tries failed), and Rudy Kessinger's fourth field goal, from 48 at 1:50, won it. Brayden Roggow threw three touchdowns on 229 yards and Jordan Gant ran 22 times for 117; Akron was better per play, 6.4 to 5.2, with zero giveaways to EMU's two. Noah Kim threw it 46 times for 277.
PPR: 1 per catch, 0.1 per rushing or receiving yard, 6 per touchdown, 0.04 per passing yard, 4 per passing touchdown, -2 per interception. Half is half-PPR. Tgt% is the share of the team's targets.
PPR: 1 per catch, 0.1 per rushing or receiving yard, 6 per touchdown, 0.04 per passing yard, 4 per passing touchdown, -2 per interception. Half is half-PPR. Tgt% is the share of the team's targets.
Buffalo caught 18.5 and won 23-8. The Bulls led 16-0 into the fourth on a Jason Wright 3-yard run and three Oliver Hautanen field goals. Toledo scored at 4:45 with a two-point conversion and Messiah Burch ran 87 yards 15 seconds later; he had 137 on 17 carries. Toledo averaged 5.0 a play to Buffalo's 4.5, gave the ball away three times, went 3 of 14 on third down and took 137 penalty yards. The total was 54.5 and they scored 31.
PPR: 1 per catch, 0.1 per rushing or receiving yard, 6 per touchdown, 0.04 per passing yard, 4 per passing touchdown, -2 per interception. Half is half-PPR. Tgt% is the share of the team's targets.
PPR: 1 per catch, 0.1 per rushing or receiving yard, 6 per touchdown, 0.04 per passing yard, 4 per passing touchdown, -2 per interception. Half is half-PPR. Tgt% is the share of the team's targets.
Ohio laid 2.5 and won 31-14. It was 31-0 at the half after Dom Dorwart's 44-yard catch with six seconds left. Nick Poulos went 11 of 18 for 158 and three touchdowns, Duncan Brune ran 16 times for 91 with a 23-yard score, and Ohio went 9 of 14 on third down. Central Michigan's 14 came in the last 15 minutes. Angel Flores went 14 of 20 for 112. The total was 45.5 and they scored 45.
PPR: 1 per catch, 0.1 per rushing or receiving yard, 6 per touchdown, 0.04 per passing yard, 4 per passing touchdown, -2 per interception. Half is half-PPR. Tgt% is the share of the team's targets.
PPR: 1 per catch, 0.1 per rushing or receiving yard, 6 per touchdown, 0.04 per passing yard, 4 per passing touchdown, -2 per interception. Half is half-PPR. Tgt% is the share of the team's targets.
Western Michigan laid 13.5 and won 38-7. Broc Lowry went 18 of 26 for 257 and three touchdowns, two to Adam Parks (42 yards on the first drive, 4 yards in the fourth), and ran in another. Jalen Buckley carried 16 times for 105. Kent State took four sacks, went 3 of 13 on third down and had 100 penalty yards; Wayne Harris caught 11 for 164 and Dru DeShields threw a pick.
PPR: 1 per catch, 0.1 per rushing or receiving yard, 6 per touchdown, 0.04 per passing yard, 4 per passing touchdown, -2 per interception. Half is half-PPR. Tgt% is the share of the team's targets.
PPR: 1 per catch, 0.1 per rushing or receiving yard, 6 per touchdown, 0.04 per passing yard, 4 per passing touchdown, -2 per interception. Half is half-PPR. Tgt% is the share of the team's targets.
UConn caught 3.5 and won 34-20. Four touchdowns in the first eight minutes, 14-14, including JoJo Bermudez's 79-yarder and Kenji Christian's 39-yard run. Temple led 17-14 in the second. Trey Cornist's 1-yard run and a Jack O'Connor field goal as the half ended gave UConn 24-17, Temple cut it to 24-20 in the third, and Cyncir Bowers' 8-yard run with 7:52 left settled it. UConn had 505 yards at 8.0 a play, ran it at 7.5 a carry (Cornist 7 for 114), and Kalieb Osborne went 17 of 23 for 257. Two Temple giveaways. Seven sacks in the game.
PPR: 1 per catch, 0.1 per rushing or receiving yard, 6 per touchdown, 0.04 per passing yard, 4 per passing touchdown, -2 per interception. Half is half-PPR. Tgt% is the share of the team's targets.
PPR: 1 per catch, 0.1 per rushing or receiving yard, 6 per touchdown, 0.04 per passing yard, 4 per passing touchdown, -2 per interception. Half is half-PPR. Tgt% is the share of the team's targets.
Oregon State laid 14.5 and won 66-14. Braden Atkinson went 29 of 38 for 409 and five touchdowns; Jesse Legree caught 10 for 191 and three of them (11, 71 and 31 yards). It was 35-0 with six minutes left in the half and 59-7 in the third. Oregon State went 12 of 17 on third down and had 651 yards. San Diego State had 147 yards, went 2 of 13 on third down and Jayden Denegal went 5 of 19 for 78. Jaylon Hawkins' 97-yard kickoff return was half of San Diego State's points. Maalik Murphy caught a touchdown in the first quarter and threw one in the fourth. The total was 52.5 and they scored 80.
PPR: 1 per catch, 0.1 per rushing or receiving yard, 6 per touchdown, 0.04 per passing yard, 4 per passing touchdown, -2 per interception. Half is half-PPR. Tgt% is the share of the team's targets.
PPR: 1 per catch, 0.1 per rushing or receiving yard, 6 per touchdown, 0.04 per passing yard, 4 per passing touchdown, -2 per interception. Half is half-PPR. Tgt% is the share of the team's targets.
Memphis laid 15.5 and won 38-13. UAB led 13-10 at the half on Jonah Delange's 57-yard field goal. Memphis scored 28 straight after that: Jaylin Carter from 24, Tychaun Chapman on a 45-yard catch, Hunter Tipton from the 1 and Aidan O'Callaghan from 11. Carter ran 19 times for 132 and two scores. UAB gave it away three times, went 3 of 15 on third down and Ryder Burton took three sacks. The total was 55.5 and they scored 51.
PPR: 1 per catch, 0.1 per rushing or receiving yard, 6 per touchdown, 0.04 per passing yard, 4 per passing touchdown, -2 per interception. Half is half-PPR. Tgt% is the share of the team's targets.
PPR: 1 per catch, 0.1 per rushing or receiving yard, 6 per touchdown, 0.04 per passing yard, 4 per passing touchdown, -2 per interception. Half is half-PPR. Tgt% is the share of the team's targets.
Nevada laid 10 and won 30-13. Herschel Turner ran 19 times for 192, a 72-yarder late in the third for 23-7. Carter Jones threw for 82 and a touchdown. UTEP went 1 of 14 on third down, had 211 yards and took four sacks. Raymond Moore threw two touchdowns and ran for 65. Dominic Kelley's 6-yard run with 3:54 left made it 30-7.
PPR: 1 per catch, 0.1 per rushing or receiving yard, 6 per touchdown, 0.04 per passing yard, 4 per passing touchdown, -2 per interception. Half is half-PPR. Tgt% is the share of the team's targets.
PPR: 1 per catch, 0.1 per rushing or receiving yard, 6 per touchdown, 0.04 per passing yard, 4 per passing touchdown, -2 per interception. Half is half-PPR. Tgt% is the share of the team's targets.
North Dakota State laid 3 and lost 13-7. Andre Porter's 23-yard interception return in the first quarter was UNLV's only touchdown; Ramon Villela added field goals from 29 and 24. Nathan Hayes threw three picks on 22 attempts. North Dakota State was the better team per play, 4.9 to 4.0, and Myles Mitchell ran 22 times for 91. Jackson Arnold went 8 of 16 for 77 with a pick and Jai'Den Thomas ran for 112. The total was 47.5 and they scored 20.
PPR: 1 per catch, 0.1 per rushing or receiving yard, 6 per touchdown, 0.04 per passing yard, 4 per passing touchdown, -2 per interception. Half is half-PPR. Tgt% is the share of the team's targets.
PPR: 1 per catch, 0.1 per rushing or receiving yard, 6 per touchdown, 0.04 per passing yard, 4 per passing touchdown, -2 per interception. Half is half-PPR. Tgt% is the share of the team's targets.
Coastal Carolina caught 4.5 and won 27-21. Marshall gave the ball away six times. Coastal led 27-0 midway through the third after Dominic Lee-Knicely's 70-yard run (he had 169 on 25 carries) and a 2-yard Jaden Allen-Hendrix score. Judah Price ran 50 yards for Marshall's first touchdown and caught a 9-yarder with 2:52 left; Owen Sweeney's 19-yard catch at 2:14 made it 27-21. Marshall had 505 yards, went 9 of 15 on third down and averaged 6.5 a play to Coastal's 4.9. Deuce Bailey went 8 of 18 for 73.
PPR: 1 per catch, 0.1 per rushing or receiving yard, 6 per touchdown, 0.04 per passing yard, 4 per passing touchdown, -2 per interception. Half is half-PPR. Tgt% is the share of the team's targets.
PPR: 1 per catch, 0.1 per rushing or receiving yard, 6 per touchdown, 0.04 per passing yard, 4 per passing touchdown, -2 per interception. Half is half-PPR. Tgt% is the share of the team's targets.
Virginia laid 14 and won 28-25, so Syracuse cashed. Syracuse led 17-7 at the half. Da'Shawn Martin's 43-yard catch and two short Jekail Middlebrook runs put Virginia up 28-17 with 5:20 left; Daunte Bacheyie's 46-yard catch from Danny Lauter and a two-point throw at 2:50 made it a field goal game. Tylik Hill ran 23 times for 118 and Umari Hatcher caught 8 for 126. Syracuse had 430 yards to Virginia's 288 and there were no turnovers in the game. Middlebrook ran 17 times for 95.
PPR: 1 per catch, 0.1 per rushing or receiving yard, 6 per touchdown, 0.04 per passing yard, 4 per passing touchdown, -2 per interception. Half is half-PPR. Tgt% is the share of the team's targets.
PPR: 1 per catch, 0.1 per rushing or receiving yard, 6 per touchdown, 0.04 per passing yard, 4 per passing touchdown, -2 per interception. Half is half-PPR. Tgt% is the share of the team's targets.
Air Force laid 7 and won 28-7 while attempting one pass (incomplete). Evan Medders ran 16 times for 114 and two touchdowns, Owen Allen scored from 3 and 33, and the Falcons went 10 of 13 on third down on 433 yards. Northern Illinois ran 43 plays and Taron Dickens threw a pick. Nobody scored in the fourth quarter. The total was 48.5 and they scored 35.
PPR: 1 per catch, 0.1 per rushing or receiving yard, 6 per touchdown, 0.04 per passing yard, 4 per passing touchdown, -2 per interception. Half is half-PPR. Tgt% is the share of the team's targets.
PPR: 1 per catch, 0.1 per rushing or receiving yard, 6 per touchdown, 0.04 per passing yard, 4 per passing touchdown, -2 per interception. Half is half-PPR. Tgt% is the share of the team's targets.
Louisiana Tech laid 3 and won 32-31, so Louisiana cashed. Louisiana led 31-19 after KeDarius Wade's 45-yard catch with 11:34 left. Blake Baker ran 12 yards for a score at 3:44 and hit Eli Finley from 7 with 46 seconds left; the two-point run failed and the margin stayed at one. Baker went 32 of 42 for 319 and three touchdowns, Finley caught 9 for 114 and two of them. Louisiana was better per play, 6.9 to 6.3, but Lunch Winfield threw two picks and the Cajuns gave it away three times. The total was 48.5 and they scored 63.
PPR: 1 per catch, 0.1 per rushing or receiving yard, 6 per touchdown, 0.04 per passing yard, 4 per passing touchdown, -2 per interception. Half is half-PPR. Tgt% is the share of the team's targets.
PPR: 1 per catch, 0.1 per rushing or receiving yard, 6 per touchdown, 0.04 per passing yard, 4 per passing touchdown, -2 per interception. Half is half-PPR. Tgt% is the share of the team's targets.
Minnesota laid 2.5 and lost 41-13. Fame Ijeboi ran 31 times for 195 and three touchdowns. Ryan Browne went 14 of 24 for 159, threw one score and ran in another. Purdue led 20-3 at the half. Minnesota ran it at 2.1 a carry (Darius Taylor 7 for 15), went 4 of 13 on third down and gave it away twice. No sacks in the game. Drake Lindsey threw for 248 with a pick.
PPR: 1 per catch, 0.1 per rushing or receiving yard, 6 per touchdown, 0.04 per passing yard, 4 per passing touchdown, -2 per interception. Half is half-PPR. Tgt% is the share of the team's targets.
PPR: 1 per catch, 0.1 per rushing or receiving yard, 6 per touchdown, 0.04 per passing yard, 4 per passing touchdown, -2 per interception. Half is half-PPR. Tgt% is the share of the team's targets.
James Madison laid 7 and won 27-24, so Georgia Southern cashed. Georgia Southern led 10-6 at the half. Jeremiah Harrison's 2-yard catch and Cole Keller's 57-yard catch from JC Evans put JMU up 20-10, and KD Mosley's 1-yard catch from Evans at 5:27 made it 27-17. Max Johnson threw for 343 and three touchdowns, the last to Andre Greene with 2:27 left. Georgia Southern averaged 7.2 a play to JMU's 5.7 and outgained the Dukes 465 to 438, with two giveaways. George Pettaway ran 21 times for 151. JMU took three sacks. The total was 51.5 and they scored 51.
PPR: 1 per catch, 0.1 per rushing or receiving yard, 6 per touchdown, 0.04 per passing yard, 4 per passing touchdown, -2 per interception. Half is half-PPR. Tgt% is the share of the team's targets.
PPR: 1 per catch, 0.1 per rushing or receiving yard, 6 per touchdown, 0.04 per passing yard, 4 per passing touchdown, -2 per interception. Half is half-PPR. Tgt% is the share of the team's targets.
Arizona State laid 20.5 and won 30-12, so Hawai'i cashed by 2.5. Cardae Mack ran 13 times for 154 and two touchdowns, a 67-yarder late in the third for 24-6. Cutter Boley went 21 of 31 for 189 and two scores to Reed Harris, the second with 1:55 left. Micah Alejado threw it 49 times for 252 with a pick and three sacks; Hawai'i went 7 of 19 on third down. Audric Harris' 32-yard catch early in the fourth got the Warriors inside the number. The total was 51.5 and they scored 42.
PPR: 1 per catch, 0.1 per rushing or receiving yard, 6 per touchdown, 0.04 per passing yard, 4 per passing touchdown, -2 per interception. Half is half-PPR. Tgt% is the share of the team's targets.
PPR: 1 per catch, 0.1 per rushing or receiving yard, 6 per touchdown, 0.04 per passing yard, 4 per passing touchdown, -2 per interception. Half is half-PPR. Tgt% is the share of the team's targets.
Want our plays emailed to you? Sign up free below.
Free picks and weekly recaps, in your inbox.
Every card we play, emailed before game time, plus a recap of every CFB and NFL game each week. Every result tracked, wins and losses. Free, unsubscribe anytime.
RatingPoints better or worse than an average FBS team on a neutral field.
Off / DefOverall offense and defense rankings, adjusted for opponent: points and yards per play, each measured against the defenses and offenses a team has faced. No. 1 is best.
ProjCurrent record plus the win chance in every game left.
YdsYards per game on offense. Pass and Rush split it.
Opp YdsYards allowed per game.
PenPenalty yards per game. No. 1 is the cleanest team.
TOTurnover margin for the season.
OL / DLLine rankings from play-by-play: line yards per carry, sack rate, stuffs and short-yardage conversions for the offensive line, the same against for the defensive line. No. 1 is best. These are proxies from the play log, not charted blocking.
STSpecial teams ranking: field-goal pct, punt average, kick and punt return averages for and against, and return-touchdown margin. No. 1 is best.
LuckWins minus the wins its points scored and allowed would normally produce. Plus means the record runs ahead of the play.
1-ScoreRecord in games decided by 8 or fewer.
SOSAverage rating of opponents played. SOS Left is the ones still to play. No. 1 is the hardest.
RanksThe small number beside a stat is its national rank. No. 1 is best.